
Customer Svc: 855-620-2330 -
M-Sat -9am-6pm
Speak To Customer Service - 855-620-2330 - M-Sat 9:00am - 6:00pm MST
Customer Svc: 855-620-2330 -
M-Sat -9am-6pm
Speak To Customer Service - 855-620-2330 - M-Sat 9:00am - 6:00pm MST

Last Updated: September 14, 2026
Launch monitor data accuracy for teaching is the degree to which a device's reported ball and club measurements match what actually happened at impact. When a reading is wrong, the lesson built on it is wrong too. This guide covers how radar and camera systems differ, which metrics matter in a lesson, and how to validate your monitor before staking a student's swing change on it.
A launch monitor can be precise and still inaccurate. Precision means the same number every time you hit the same shot; accuracy means that number is correct. A device that consistently reads 4 mph slow is precise and inaccurate, and every fix you prescribe from it sits on a shifted baseline (nist.gov).
Radar and camera launch monitors measure the same event through different physics, and each has blind spots. Radar tracks the club and ball through space over time; cameras capture still frames at impact. Neither is universally better, the right choice depends on your bay dimensions, teaching style, and what you need to measure.
Radar launch monitors rely on the Doppler effect, bouncing a microwave signal off the clubhead and ball and measuring the frequency shift as they move (Physics Tutorial - Vibrations and Waves - Behaviors of Waves). Watching the entire flight lets them capture club head speed, ball speed, and carry distance from one continuous track.
The trade-off is placement. Radar needs a clear runway in front of the ball, typically several feet of depth, so it struggles in short indoor bays where the ball hits a screen before the radar can follow it. Units that combine radar with high-speed imaging, like the FlightScope X3C, pair Doppler tracking with image processing to hold accuracy in tighter spaces.

Camera systems use photogrammetry: high-speed cameras capture the ball and club at impact, then software reconstructs launch angle, spin rate, and club path from those frames. Ball Optix technology, used in units like the Uneekor Eye Mini and Eye XO2, reads the ball's dimple pattern to calculate spin without marked balls.
These systems excel indoors because they only need a defined hitting zone, not a long flight path. The catch is lighting and alignment. Cameras need consistent illumination and a calibrated field of view, and a bumped or drifted unit will report confidently wrong numbers until you recalibrate.
Not every data point deserves a place in a lesson. The metrics below reliably change student behavior.
Ball speed, launch angle, spin rate, and carry distance form the core of ball flight laws: the ball's path is a product of how fast it leaves the face, at what angle, and with how much spin. Smash factor, the ratio of ball speed to club head speed, shows how efficiently the student transferred energy at impact.
Side spin and back spin explain curvature and trajectory. When a student's slice won't respond to a grip change, side spin data often reveals the face angle issue driving it, turning a vague "you're coming over the top" into a measurable target.
Club delivery data explains why the ball did what it did. Angle of attack, club path, face angle, dynamic loft, and impact location tell you how the club arrived at the ball, the part of the swing a student can actually change.
Track club head speed to gauge potential, but treat face angle and club path as the diagnostic pair. Most directional problems trace back to the relationship between those two numbers, not raw speed.
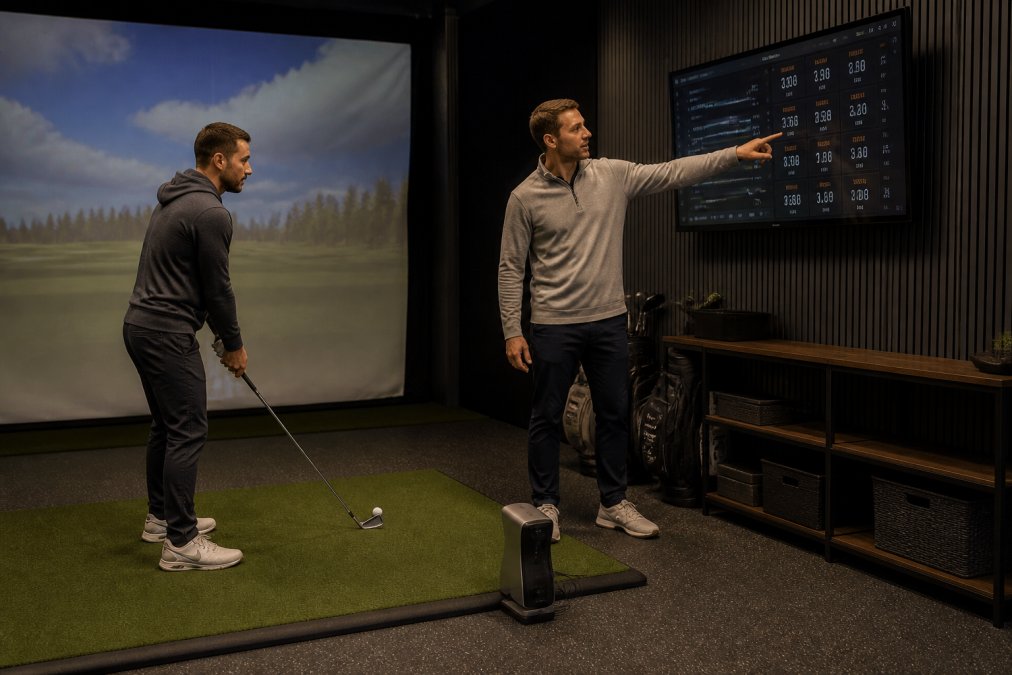
The first rule of interpreting data for a student is to give them one number at a time. The reason is cognitive, not stylistic.
Working memory holds only a handful of items at once (pubmed.ncbi.nlm.nih.gov). When a student sees club path, face angle, dynamic loft, spin rate, and smash factor on the same screen, they process five data points plus their relationships plus the swing feel they are trying to reproduce. The load exceeds capacity, and the brain falls back on its most automated behavior: the old swing.
That is the paradox instructors hit constantly: the student performs worse after seeing more data, not because the data is wrong but because it consumed the attention needed to make the change. The screen becomes pressure rather than feedback.
A common pattern: the mid-handicap player improves steadily with a single metric on screen, then regresses the moment the instructor opens the full data panel. The information was accurate; the delivery was the problem.
Treat metrics as a curriculum, not a dashboard. This sequence keeps cognitive load inside working memory while building understanding.
The number of metrics a student can productively use scales with skill and experience with data, not handicap alone.
There is a case for opening the full panel, and it is diagnostic, not instructional. When a student's ball flight does not match any single-metric explanation, the instructor needs the full data set to find the cause, but should analyze silently and present only the conclusion. The student needs the one number that follows, not the reasoning.
Where you install a launch monitor matters as much as which one you buy. Radar and camera systems fail differently under different conditions; knowing the mechanism lets you diagnose a bad reading instead of blaming the student's swing.
Radar units calculate carry distance by tracking the ball and modeling the drag and lift forces acting on it. That model assumes a standard atmosphere; when actual air density diverges, reported carry drifts even though ball speed and launch angle are correct.
Radar carry numbers are reliable for shot-to-shot comparison within a session, but need atmospheric correction before comparing across days or facilities at different elevations.
Camera systems do not model the atmosphere; they reconstruct impact from images. That makes them immune to air density but acutely sensitive to anything that changes how the ball and club appear to the sensor.
Radar is unaffected by visible light but affected by anything that reflects or absorbs microwaves. Metal shelving, HVAC ductwork, and metal-framed screen enclosures can create reflections the unit reads as a second ball track, producing plausible-but-wrong club head speed or impossible spin numbers. Keep the radar's field of view clear of large metal objects and don't aim it at a reflective wall behind the screen.
A consumer can shrug off a 4-yard carry discrepancy; an instructor cannot, because it shows up in the lesson plan. If your radar reads short because of altitude and you correct the student's angle of attack to chase missing yards, you have coached a fix for a problem that does not exist. Establish your facility's baseline conditions once, document them, and treat any reading outside the normal variance band as a sensor or environment question before a swing question.
Before you teach to a number, prove the number is real. A simple weekly validation routine keeps your data trustworthy.
A practical validation protocol:
Metric standardization is the second half of the problem. Two monitors in the same facility can report different spin rates for the same shot, confusing students who practice in multiple bays. Pick one unit as your reference standard, and validate any second unit against it before trusting it.
Validation Check |
Frequency |
What It Catches |
Action If It Fails |
|---|---|---|---|
Position and alignment |
Before each lesson |
Sensor drift |
Re-align to floor marks |
Ten-shot baseline |
Weekly |
Reporting shift |
Recalibrate unit |
Cross-unit comparison |
On install |
Metric mismatch |
Set reference standard |
Mat and lighting check |
Monthly |
Reading distortion |
Replace mat, fix lighting |
Match the device to your space and students, not the spec sheet with the most data points. Full-depth bays with room for radar suit Doppler systems; tighter indoor studios should lean toward camera-based photogrammetry.
For a commercial teaching studio, the FlightScope X3C pairs radar and image processing for full ball and club data in one unit. For a home studio or smaller bay, the Uneekor Eye Mini delivers 19 ball and club data points from a portable camera-based unit, while the Uneekor Eye XO2 uses three high-speed cameras for a wide hitting zone. The TruGolf Apogee captures measured data through a stereoscopic camera system suited to indoor simulation.

Whichever you choose, buy from a source that will help you get the installation right. Total Golf Simulators offers a Simulator Finder Quiz to match a setup to your space and budget, plus expert guidance for home and commercial environments. Our team can confirm your bay dimensions and equipment compatibility before you commit, so you're not guessing whether a projector, enclosure, and launch monitor will work together.
Accuracy varies by technology and calibration. Radar-based units like the FlightScope X3C use Doppler tracking to measure ball speed, launch angle, and spin rate with high precision. Camera-based systems like the Uneekor Eye XO2 use photogrammetry and infrared sensors to capture 24 data points. Both can be reliable for instruction when properly calibrated and aligned. The key is consistent setup, regular calibration, and understanding each device's measurement tolerances so you can trust the feedback you give students.
Radar-based launch monitors track the ball through its full flight using the Doppler effect, which gives strong outdoor carry distance and ball speed readings. Camera-based systems capture impact and initial ball flight with high-speed imaging, which excels indoors where space is limited. Radar systems can struggle with short indoor distances, while camera systems may need reflective markers for club data. Neither is universally more accurate. The right choice depends on your teaching environment and which data points matter most for your students.
Focus on ball speed, launch angle, spin rate, club head speed, smash factor, carry distance, angle of attack, club path, and face angle. These metrics reveal the relationship between swing mechanics and ball flight laws. Ball speed and smash factor show impact efficiency. Club path and face angle explain shot direction. Angle of attack and dynamic loft affect trajectory and spin. Tracking shot dispersion across multiple swings helps students see patterns rather than one-off results.
Start by establishing a baseline with 10 to 15 shots, then identify the one or two metrics causing the biggest distance or accuracy loss. Use the feedback loop to show students how a swing change affects ball flight in real time. For example, if a student's club path is consistently outside-in, demonstrate how adjusting setup changes shot dispersion. Avoid overwhelming students with every data point. Prioritize the metrics that connect directly to their stated goal, whether that is distance, consistency, or shot shaping.